How to Export Earnings, Dividend, Split, and IPO Calendars
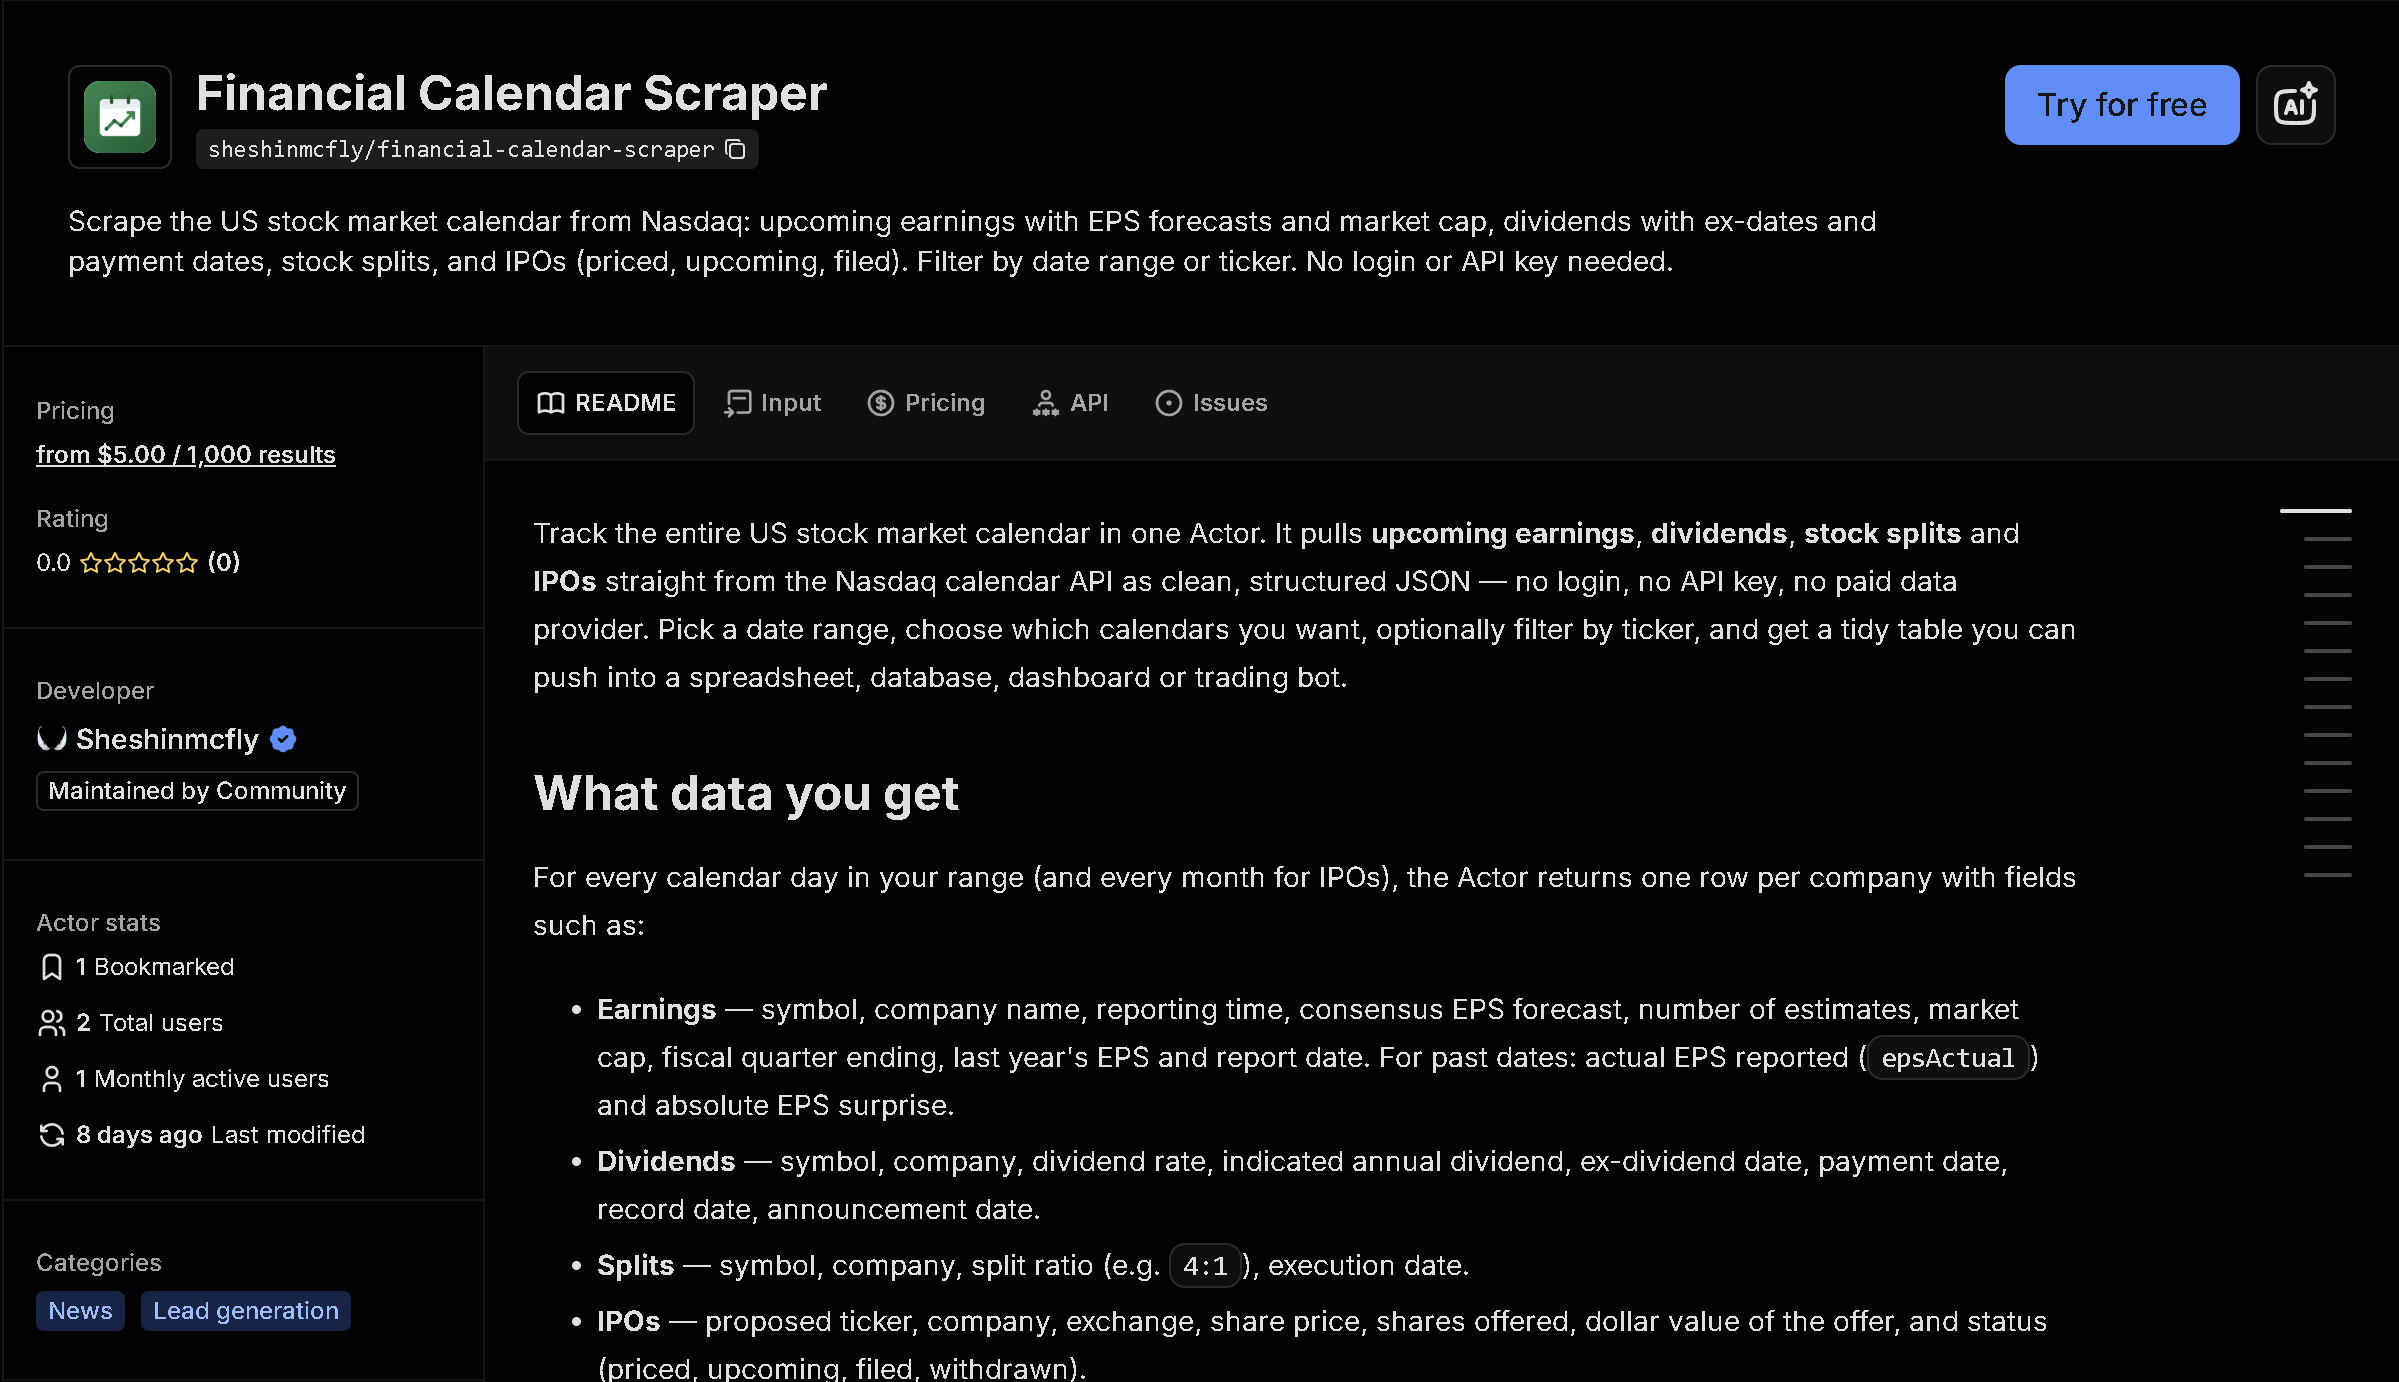
Nasdaq publishes daily earnings, dividend, stock split, and IPO calendars, but only as browsable web pages with no bulk export. This tool pulls any of these four calendars for a date range and returns every company on the calendar as structured data — EPS forecasts, market cap, dividend rates, split ratios, or IPO pricing depending on which calendar you request.
In short: Manually checking which companies report earnings or go ex-dividend each day doesn't scale across a multi-week window, and the data resets every day. This tool automates it — you get structured, ready-to-use data instead of copying it by hand.
What the data shows: In this sample of the 10 largest companies reporting earnings in a single week, forecasted EPS ranges from $4.40 to $2.86 — a full week's earnings lineup that would otherwise mean checking a calendar page day by day.
Sample data
| Ticker | Company | Report Date | EPS Forecast | Market Cap |
|---|---|---|---|---|
| GOOG | Alphabet Inc. | 2026-07-22 | $2.86 | $4.49T |
| GOOGL | Alphabet Inc. | 2026-07-22 | $2.86 | $4.49T |
| TSLA | Tesla, Inc. | 2026-07-22 | $0.29 | $1.48T |
| INTC | Intel Corporation | 2026-07-23 | $0.10 | $517.6B |
| NVS | Novartis AG | 2026-07-21 | $2.20 | $287.7B |
| GEV | GE Vernova Inc. | 2026-07-22 | $3.16 | $283.6B |
| PM | Philip Morris International Inc | 2026-07-22 | $2.04 | $281.9B |
| TXN | Texas Instruments Incorporated | 2026-07-22 | $1.91 | $274.1B |
| RTX | RTX Corporation | 2026-07-23 | $1.66 | $263.8B |
| AXP | American Express Company | 2026-07-24 | $4.40 | $244.6B |
What each field means
| Field | Description |
|---|---|
symbol, companyName, marketCap | Ticker, company name, and market capitalization |
date, earningsTime | Calendar date and whether it reports before/after market hours (earnings calendar) |
epsForecast, numberOfEstimates, lastYearEps, epsActual, surprise | Analyst EPS forecast, how many analysts contributed, last year's actual, and the surprise once reported (earnings calendar) |
Dividend calendar fields | Ex-date, payment date, dividend rate, and yield |
Split calendar fields | Split ratio and execution date |
IPO calendar fields | Pricing status (priced, upcoming, filed, withdrawn), share price range, and shares offered |
How to use it
- Open the tool on Apify (link below).
- Fill in the search form — no code required.
- Run it and wait for it to finish (usually seconds).
- Download your results as JSON, CSV, or Excel.
Frequently asked questions
Do I need to know how to code?
No. You pick which calendar(s) and a date range, then download the results as JSON, CSV, or Excel.
Is this real-time data?
Yes, every run fetches the current calendar directly from Nasdaq at the time you run it.
Can I filter to specific tickers?
Yes, you can pass a list of ticker symbols to only return rows for those companies.