How to Export Stock Screener Data (Top Gainers, Losers, Most Active)
FinViz's screener is one of the most-used tools for scanning the stock market, but it only shows results in the browser — there is no built-in way to download a screener's results as data. This tool runs any of FinViz's predefined screeners (top gainers, top losers, most active, overbought, oversold, and more) and exports the full result set as structured data.
In short: Manually copying rows from a screener page doesn't scale past a handful of tickers, and screener results change throughout the trading day. This tool automates it — you get structured, ready-to-use data instead of copying it by hand.
What the data shows: In this sample of 10 stocks from the Top Gainers screener, the average single-day price change was +42.8%, with average trading volume around 110.9M shares — the kind of momentum signal that is easy to miss browsing one ticker at a time.
Sample data
| Ticker | Company | Sector | Price | Change | Volume |
|---|---|---|---|---|---|
| TGHL | Growhub Ltd | Technology | $1.52 | +86.6% | 139.4M |
| ATPC | Agape ATP Corp | Consumer Defensive | $4.20 | +66.7% | 41.2M |
| DXST | Decent Holding Inc | Industrials | $2.99 | +43.8% | 24.5M |
| IQST | iQSTEL Inc | Communication Services | $1.22 | +38.5% | 139.1M |
| VEEE | Twin Vee PowerCats Co | Consumer Cyclical | $36.18 | +36.1% | 10.3M |
| CDNA | Caredx Inc | Healthcare | $40.34 | +35.6% | 4.5M |
| ATAI | AtaiBeckley Inc | Healthcare | $7.15 | +33.4% | 166.0M |
| MAN | ManpowerGroup | Industrials | $51.65 | +32.4% | 5.4M |
| LIMN | Liminatus Pharma Inc | Healthcare | $0.15 | +29.0% | 578.1M |
| MAAS | Maase Inc | Financial | $20.95 | +26.4% | 601.8K |
What each field means
| Field | Description |
|---|---|
ticker | Stock ticker symbol |
company | Company name |
sector, industry, country | Classification and country of listing |
price, change, changePercent, volume | Current price and intraday performance |
marketCap | Market capitalization |
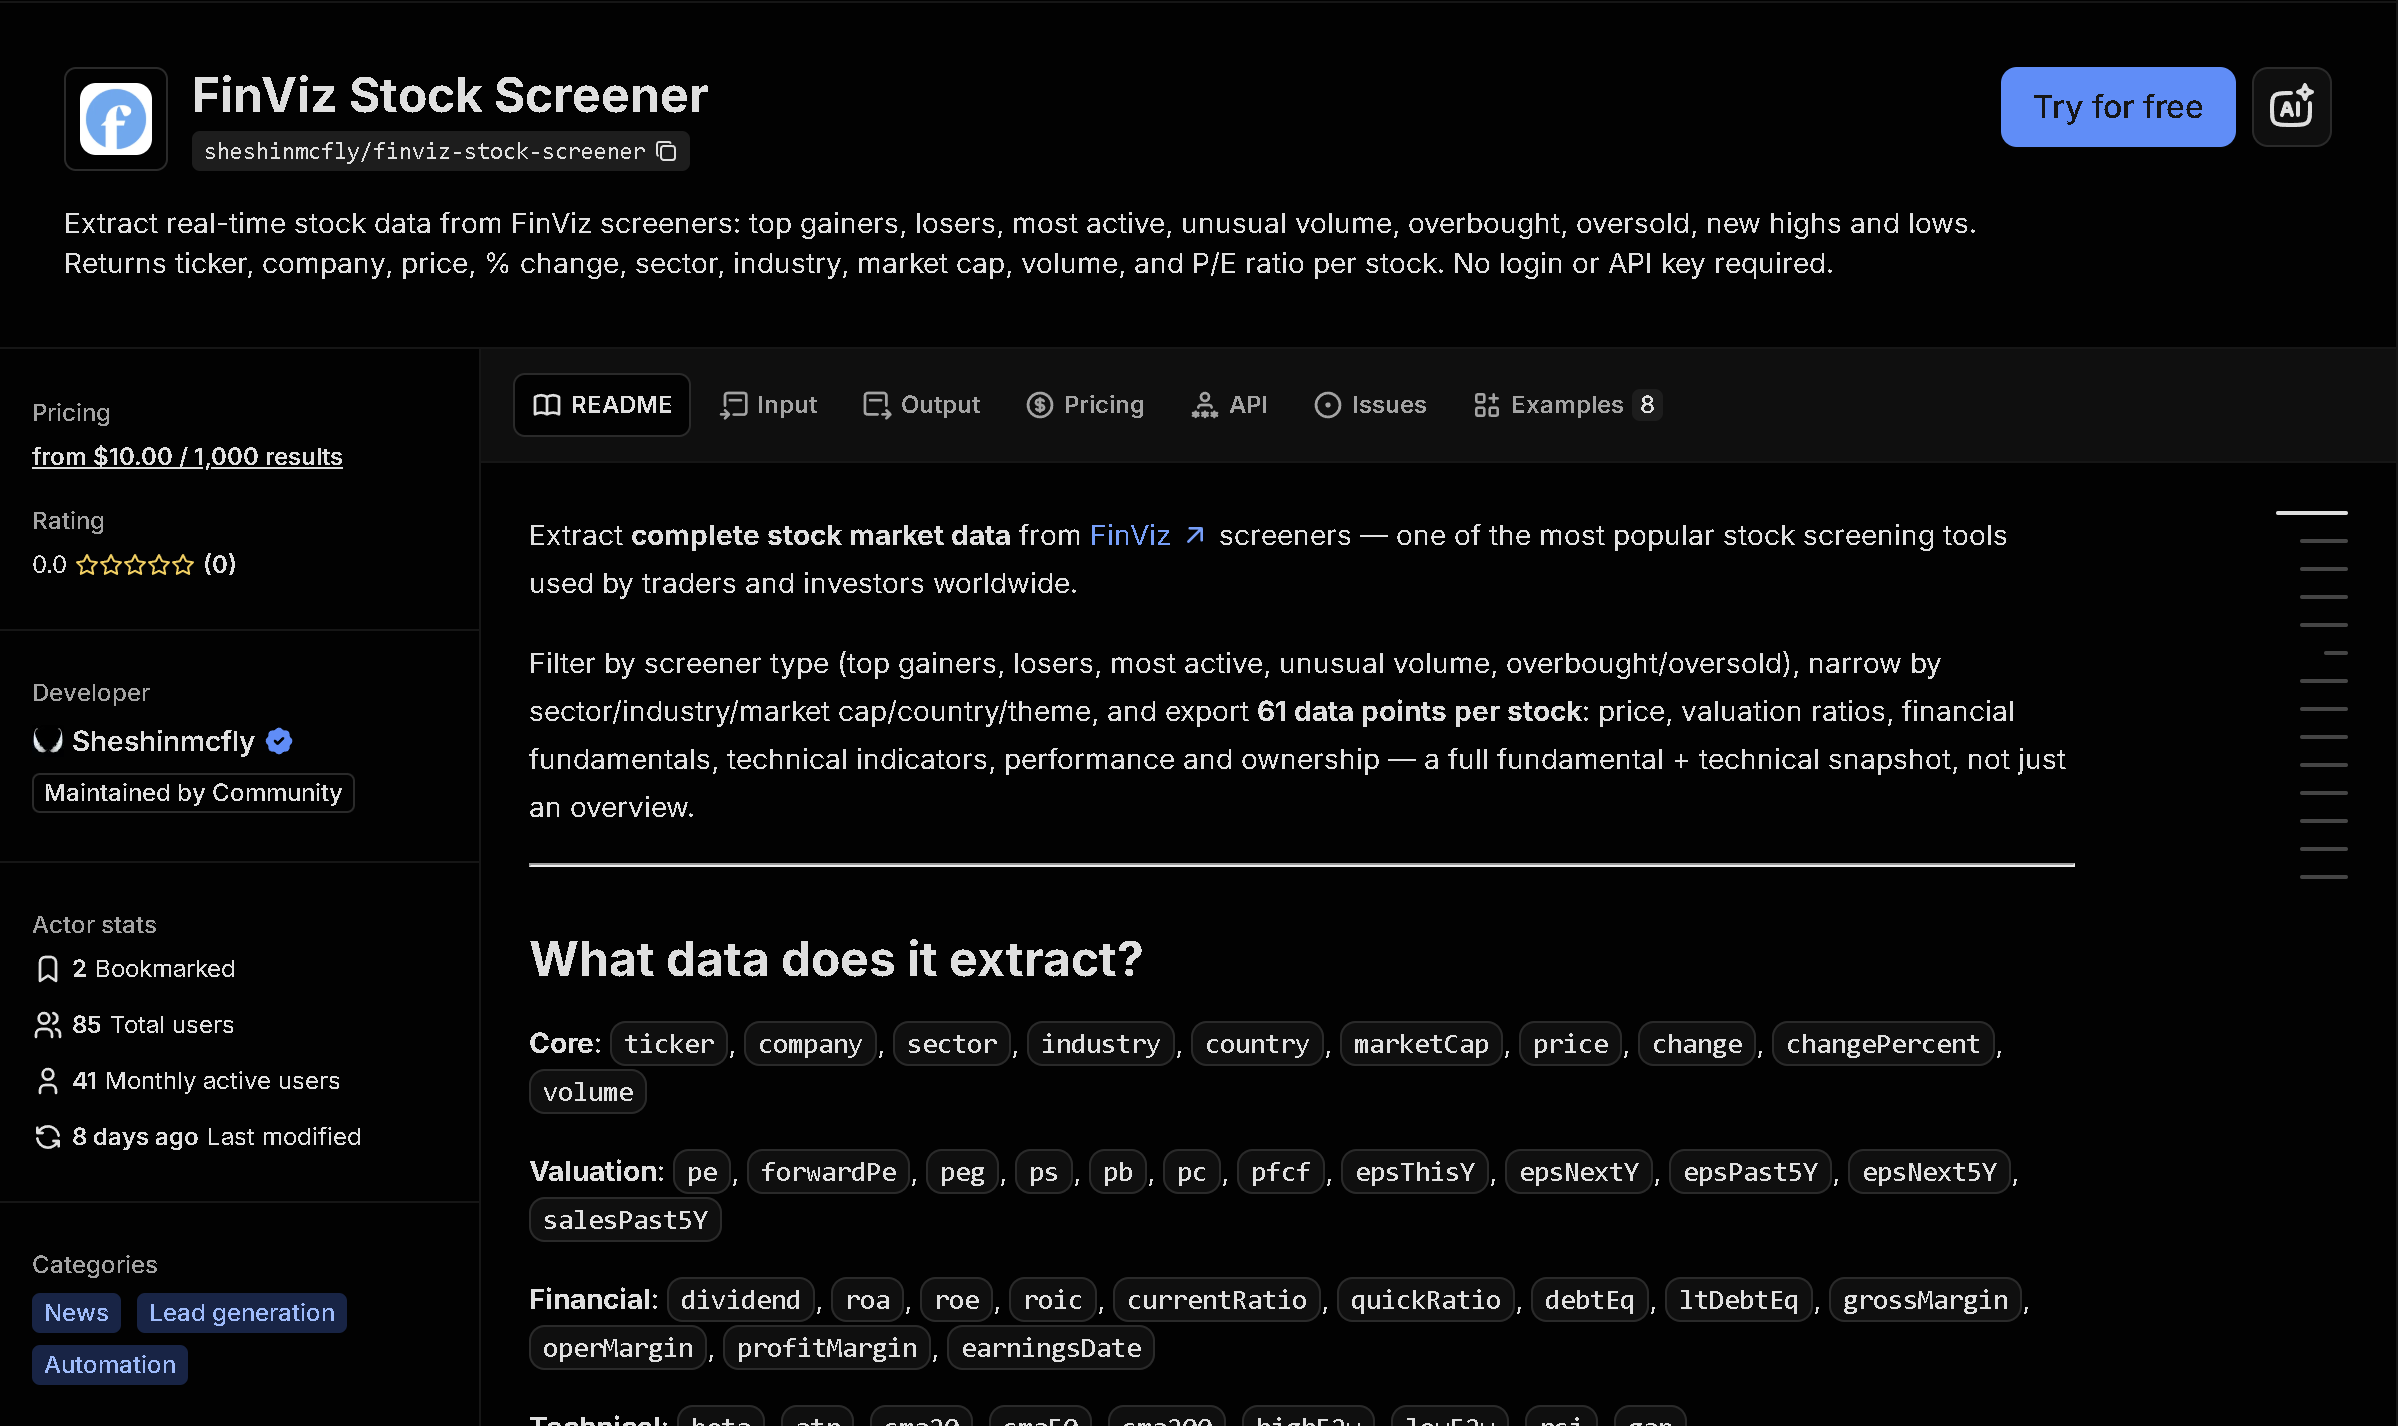
pe, forwardPe, peg, ps, pb, roe, roa, debtEq... | Fundamental valuation and financial-health ratios — available for all supported screeners, see the actor's output example for the complete field list (40+ metrics) |
sma20, sma50, sma200, rsi, high52w, low52w... | Technical indicators used for momentum and trend screens |
How to use it
- Open the tool on Apify (link below).
- Fill in the search form — no code required.
- Run it and wait for it to finish (usually seconds).
- Download your results as JSON, CSV, or Excel.
Frequently asked questions
Do I need to know how to code?
No. You pick a screener from a list (top gainers, most active, etc.) and download the results as JSON, CSV, or Excel.
Is this real-time data?
Yes, every run fetches the screener directly from FinViz at the time you run it.
Which screeners are supported?
All of FinViz's predefined technical screeners: top gainers, top losers, most active, overbought, oversold, new highs, new lows, and more.