How to Export TradingView Screener Data (70+ Fields, Any Market)
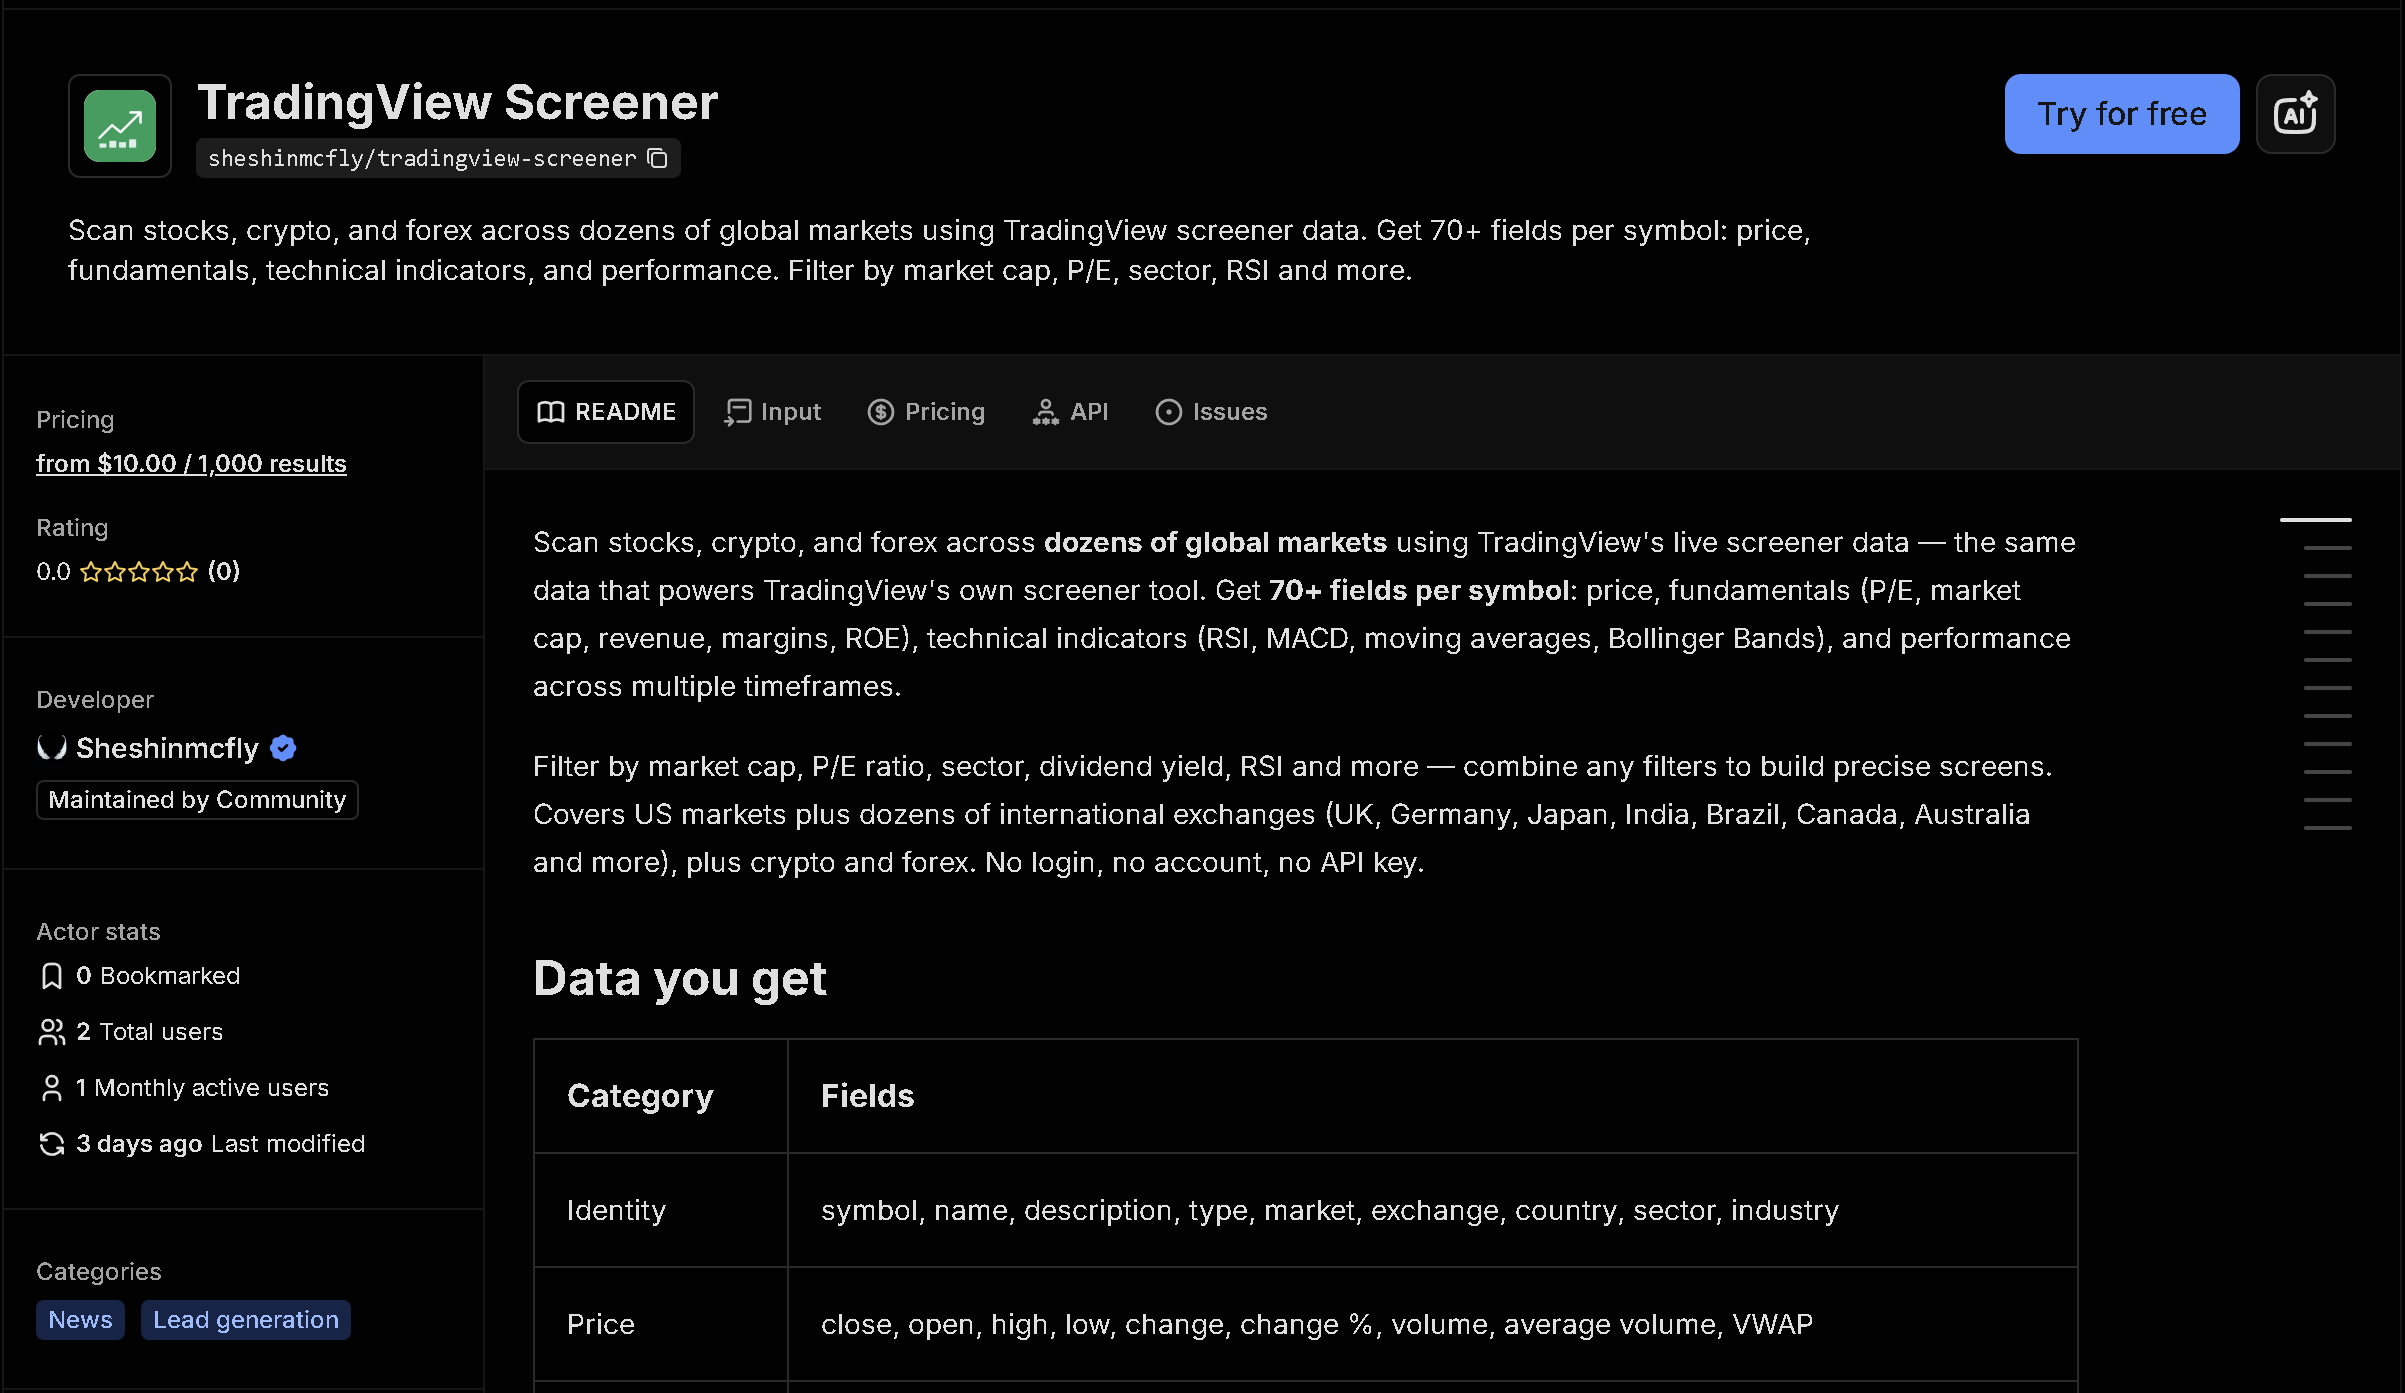
TradingView's screener is one of the most-used tools for scanning stocks, crypto, and forex, but there is no bulk export — just an interactive table. This tool queries TradingView's own scanner across any market (US, UK, Germany, Japan, crypto, forex, and dozens more) and returns up to 70+ fields per symbol: price, fundamentals, technicals, and financials.
In short: Manually filtering and copying rows from TradingView's screener doesn't scale past a handful of symbols, and the full fundamental/technical dataset isn't exportable from the site itself. This tool automates it — you get structured, ready-to-use data instead of copying it by hand.
What the data shows: In this sample of the 10 largest US companies by market cap, NVIDIA Corporation (NVDA) leads at $5.02T — each row carries the full fundamental and technical picture (P/E, RSI, moving averages, revenue, margins) in one place, not just price.
Sample data
| Ticker | Company | Sector | Market Cap | P/E |
|---|---|---|---|---|
| NVDA | NVIDIA Corporation | Electronic Technology | $5.02T | 31.8 |
| AAPL | Apple Inc. | Electronic Technology | $4.89T | 40.3 |
| GOOGN | Alphabet Inc. - Depositary Shares representing a 1/20th Interest in a Share of Series B Mandatory Convertible Preferred Stock | Technology Services | $4.51T | 3.8 |
| GOOGM | Alphabet Inc. - Depositary Shares representing a 1/20th Interest in a Share of Series A Mandatory Convertible Preferred Stock | Technology Services | $4.51T | 3.8 |
| GOOG | Alphabet Inc. | Technology Services | $4.31T | 27.0 |
| GOOGL | Alphabet Inc. | Technology Services | $4.31T | 27.0 |
| MSFT | Microsoft Corporation | Technology Services | $2.98T | 23.9 |
| AMZN | Amazon.com, Inc. | Retail Trade | $2.69T | 29.9 |
| TSM | Taiwan Semiconductor Manufacturing Company Ltd. | Electronic Technology | $1.96T | 34.1 |
| AVGO | Broadcom Inc. | Electronic Technology | $1.78T | 62.3 |
What each field means
| Field | Description |
|---|---|
name, description, exchange, country, sector, industry | Symbol identification and classification |
close, open, high, low, volume, change | Current price and intraday performance |
market_cap_basic, price_earnings_ttm, dividends_yield_current, earnings_per_share_diluted_ttm | Valuation fundamentals |
total_revenue_ttm, net_income_ttm, free_cash_flow_ttm, return_on_equity_fq | Financial performance figures |
SMA20/50/200, EMA20/50, RSI, beta_1_year | Technical indicators |
Custom columns | Override the default 70+ field set with any TradingView scanner column you want |
How to use it
- Open the tool on Apify (link below).
- Fill in the search form — no code required.
- Run it and wait for it to finish (usually seconds).
- Download your results as JSON, CSV, or Excel.
Frequently asked questions
Do I need to know how to code?
No. You pick a market and any filters (market cap, P/E, RSI, sector...), then download the results as JSON, CSV, or Excel.
Is this real-time data?
Yes, every run fetches current data directly from TradingView's scanner at the time you run it.
Does it work for crypto and forex too?
Yes, in addition to dozens of country stock markets, it supports crypto, forex, and altcoins.